← Insights Home
Know Your Performance Metrics
When does a client not care about storage performance? I think is it safe to state that everyone always cares about storage performance. Networks and storage are so central to a modern datacenter that they always matter since they affect the largest number of critical processes.
Certainly we all understand the performance of any application is a product of all the pieces required to support the application. Your customers understand that too, that is why at the first sign of slow performance you receive that familiar call: Is the filer okay?
Of course, storage is only one piece of the performance puzzle. But, if we are using spinning disk then storage latency is typically measured in milliseconds while many other latencies can be measured in microseconds. Spinning disk is typically the "long tent pole" when examining performance because of the physical limitations of the media when compared to silicon. So it is easy to understand that when one or more applications are running slow, centralized storage is often the first stop for performance analysis (following that first call to the storage admin).
At Net2Vault we have implemented monitoring tools for our storage that are similar to what you may expect to find in a customer production environment. But it is important that you understand what NetApp performance metrics are reporting to fully understand where a performance problem may exist. Monitoring the storage can tell an informed engineer about more than the storage layer. These tools can be used to create reports for a customer after the completion of a test.
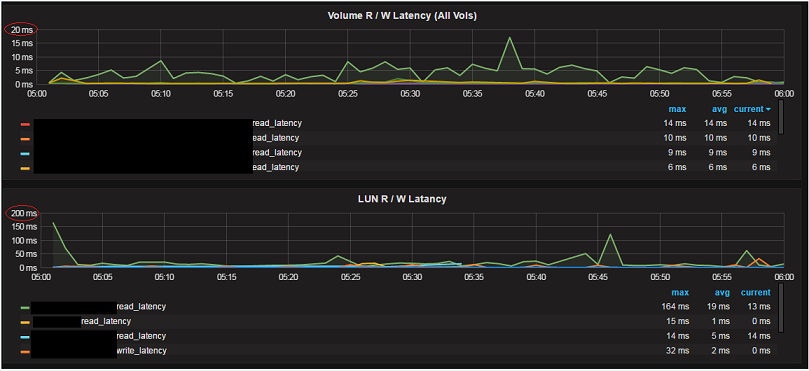
In the figure below (Example 1) there is a slice of a graph taken during a full week of disaster recovery testing that was performed for a customer. Like many Net2Vault customers, this customer performs regular testing to ensure that all the hot and cold standby equipment is configured correctly to support their datacenter needs in the event of an actual disaster. Obviously the volume and LUN names have been hidden in order to protect any customer information.
In Example 1, the top graph ("Volume R / W Latency") is the latency measured for all volumes on the dedicated filers that were involved in the test. The bottom graph in Example 1 ("LUN R / W Latency") is the LUN R/W latency for all LUNs on all the selected volumes for this customer (in this case, all volumes on the same filers). It is easy to note that the LUN latency is quite a bit higher than the volume latency.
How can this be when the LUNS are a subset of all data on the volumes and exist on the very volumes that show the lower latency times?

Example 1
The answer to this question is clear if you understand what is being measured in each graph. There are many (many) NetApp performance metrics and there is overlap. The various metrics and overlap can cause some confusion if they are not understood. Let’s examine why the graphs in this example seem to show an impossible situation by understanding what each graph truly represents.
On a NetApp system, when you view the volume latency metrics as in the top graph, you are measuring the time that is required to complete a disk operation, which includes the disk and WAFL layers. Essentially this is the time it takes to respond to a storage request once the request is received by the filer and then the received data is acknowledged as saved or sent back out the interface. As the top latencies shown in the graph are all for reads, these would be the time required to send the data out the interface.
When you measure a protocol latency on a NetApp filer, in this case iSCSI latency on a LUN, the filer will report the "round trip" time for a protocol request. Again, the top latencies are all reads so the client requests some data, the filer sends the data and then waits for the client to acknowledge that the data was received. The measured time for the request does not stop until the filer receives an acknowledgment from the client that the data has been received and stored in some fashion.
The comparison is shown in the following table:
- Receive request from client
- Start timer
- WAFL processing
- Read data from disk
- Send data to client
- Stop timer
- Receive request from client
- Start timer
- WAFL processing
- Read data from disk
- Send data to client
- Receive 'Ack' from client
- Stop timer
With this information it is easy to understand the difference between what is shown in each graph.
The NetApp filer is responding in under 20 milliseconds to all requests with almost all requests being satisfied in under 10 milliseconds. There is a single spike that displays the one time when the average latency for reads on the green volume was above 10 milliseconds. This is good response time for spinning disk. But the "protocol round trip" time for the green LUN is abysmal by computer standards! Of course, the difference is the client response time.
As it turns out, the network is fine, but the client is a VMware host that is starting many new processes during this time while also competing with other VMware instances on shared hardware that are also working hard. The time slice shown is from the beginning of the test and the customer is bringing up many servers and many processes to get testing underway.
Understanding the metrics that you monitor (You are monitoring, right?) can help you determine when there is a problem with the storage that needs to be addressed and also pinpoint where that problem may exist.
A good understanding of performance metrics can also make it quick and easy to answer the question every storage admin will hear at one time or another: Is the filer slow?